A warning using C-map with TZ

The friendliest place on the web for anyone who enjoys boating.
If you have answers, please help by responding to the unanswered posts.

Iggy

Guru
Joined
Mar 1, 2020
Messages
895
Location
United States
Vessel Make
Pacific Trawler 40
I bought TZ Navigator last December. On Feb, 17th I added C-Map to it for $250. Now C-Map for your MFD is not the same format so its treated as two different products. A little disappointed but OK.

On May 3rd I receive an e-mail that C-Map for Navigator has been updated. Unlike Garmin and C-Map for your MFD, there is no free update within the first year or next update. They will only give you a free update within 30 days! But C-Map did send me a free update for my MFD! That was good and I bought that last year.

TZ did offer 50% off to update their map. If your thinking of updating ask when the next update will be released. In may case, I don't even have my boat in the water yet and if I want to update the maps I must pay for it and I already spent $1000 within the last 4 months on the software.

Just to add, I am not trying to put them down. Just buyer beware! Their tech support has been great. A big help for me in setting up the software for my boat.
 
Last edited:
I have MFD brand choices to make, soon. I am trying hard to like Furuno, and there is a lot to like. The single biggest barrier for ME is the structure of Furuno to TZ to chart vendor. With each step you get skimmed for dollars and have 3 layers of product to deal with. I am running out of decision time, but would love to see Furuno news that somehow cleans this up. Just my opinion.
 
Thats how I am feeling. But I think Furuno would be the way to go for what
I been hearing. Myself, I have Simrad and it's steps over Garmin. I would have went with Furuno, but the guy I bought my boat from had new Simrad transducers, AP and 12" display put in.

But Furuno and TZ has some sort of relationship. So you can display radar on TZ.
 
Simrad is my current default. Not going Garmin. I'd love Furuno to take steps to beat out Simrad, but time is running out.
 
Their tech support has been great. A big help for me in setting up the software for my boat.

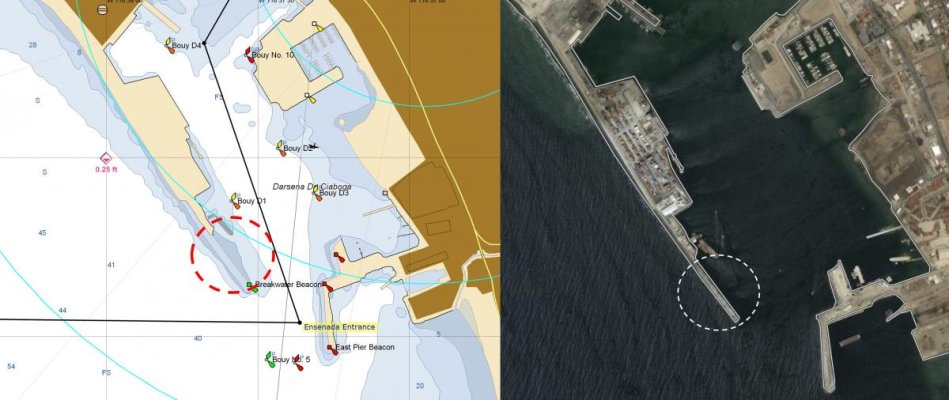
Next time you chat with Tech Support, maybe ask about their chart update policy? CMAP harbor chart for Ensenada shown below (updated a month ago) and the current aerial view. Note the missing 1000-foot breakwater extension that was completed 4-years ago. Granted there's an ATON correctly placed, but you'd think the breakwater would be shown by now.

Peter
 

Attachments

  • CMAP Ensenada missing breakwater.jpg
    CMAP Ensenada missing breakwater.jpg
    86 KB · Views: 28
Simrad is my current default. Not going Garmin. I'd love Furuno to take steps to beat out Simrad, but time is running out.

I replaced all my electronics kit about 2-years ago and went Simrad and have been happy with it, but I was not looking for a higher end system with open array and/or black box. I like the Navionics charting system and find it more intuitive than the Furuno systems I have run. I also run Coastal Explorer on a PC that is wirelessly interfaced via a CE "NEMO" box (Coastal Explorer/Rose Point product). I use ENCs for US waters, CMAP for Mexico. Not sure what I'll do when I actually get underway south from Ensenada. I may just stay with CMAP on my PC/Coastal Explorer and download routes to the MFD vs buy another license to put CMAP native on my MFD.

Peter
 
I bought TZ Navigator last December. On Feb, 17th I added C-Map to it for $250. Now C-Map for your MFD is not the same format so its treated as two different products. A little disappointed but OK.

On May 3rd I receive an e-mail that C-Map for Navigator has been updated. Unlike Garmin and C-Map for your MFD, there is no free update within the first year or next update. They will only give you a free update within 30 days! But C-Map did send me a free update for my MFD! That was good and I bought that last year.

TZ did offer 50% off to update their map. If your thinking of updating ask when the next update will be released. In may case, I don't even have my boat in the water yet and if I want to update the maps I must pay for it and I already spent $1000 within the last 4 months on the software.

Just to add, I am not trying to put them down. Just buyer beware! Their tech support has been great. A big help for me in setting up the software for my boat.


Just curious, what do the c-map charts provide that isn't already part of the free NOAA charts that are available for the Furuno TZ products? The NOAA charts have always been my first choice in US waters.
 
I replaced all my electronics kit about 2-years ago and went Simrad and have been happy with it, but I was not looking for a higher end system with open array and/or black box. I like the Navionics charting system and find it more intuitive than the Furuno systems I have run. I also run Coastal Explorer on a PC that is wirelessly interfaced via a CE "NEMO" box (Coastal Explorer/Rose Point product). I use ENCs for US waters, CMAP for Mexico. Not sure what I'll do when I actually get underway south from Ensenada. I may just stay with CMAP on my PC/Coastal Explorer and download routes to the MFD vs buy another license to put CMAP native on my MFD.

Peter


Unfortunately, c-map charts for Mexico a abysmal. Downright dangerous. I found them mostly OK for large ports, which are few and far between. But for everything else they are pretty much unfit for navigation. Navionics isn't great, but much better than c-map.


Since there was no other option, I ran c-map on Coastal explorer, and kept an iPad handy with Navionics. For any area where we planned to anchor or explore, I'd bring up the satellite photos on CE and trace the shoreline and any obstructions using the line drawing. Then I could switch back to c-map and have the line drawing showing where things actually are located.
 
Chats about gear are consolidated in identifiable threads, but chart accuracy issues are scattered.

BandB has mentioned how awful Navionics is in the Bahamas. Here we have a missing breakwater. In DE Bay there is an old breakwater generally submerged that is sometimes in charts,sometimes not, and sometimes only if you get the zoom exactly right.

Not to try to replicate Bob tracks, but somehow consolidating info on what is the accurate chart to use just where would be helpful.
 
Just curious, what do the c-map charts provide that isn't already part of the free NOAA charts that are available for the Furuno TZ products? The NOAA charts have always been my first choice in US waters.

I will say, you most likely are right! Maybe its what I am use too. I do have C-Map on my MFD. To me there were more details.

Pulse the first thing I did after installing TZ, was to down load the charts. It seamed like I was missing a few.
 
For any area where we planned to anchor or explore, I'd bring up the satellite photos on CE and trace the shoreline and any obstructions using the line drawing. Then I could switch back to c-map and have the line drawing showing where things actually are located.

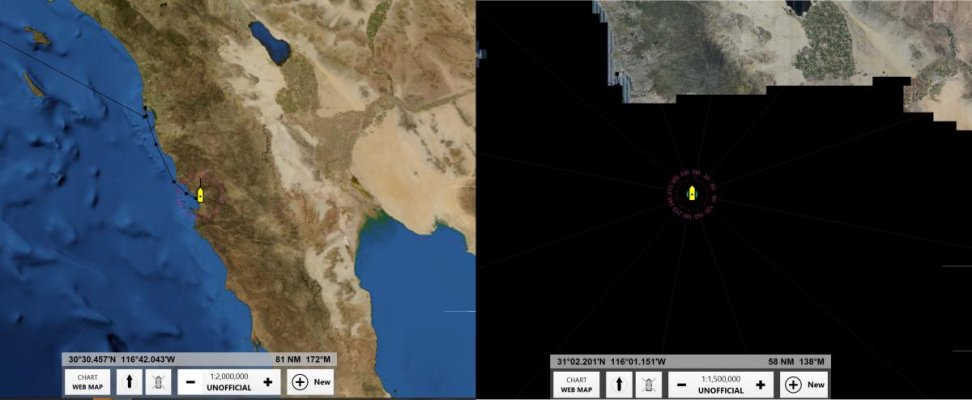
TT - I have had issues getting detailed aerial views via CE outside the US. Any tips? I just grabbed the attached two images (currently on a reliable land-based WiFi connection). If I zoom-in more than 1:2,000,000, things go black. Ideas? Can you store these images for offline use?

I see the broader Navionics package for Simrad MFD for Central America through Bahamas is $400. Compared to what E-Charts used to run for an area that size, not a bad price.

Peter

CE Web Aerial View Compare.jpg
 
Just curious, what do the c-map charts provide that isn't already part of the free NOAA charts that are available for the Furuno TZ products? The NOAA charts have always been my first choice in US waters.
I am curious about this as well! We just put in a new TZT3 system and find the pre-installed vector charts great, but I also don't know if I'm missing anything by not going to C-Map.
 
The single biggest barrier for ME is the structure of Furuno to TZ to chart vendor. With each step you get skimmed for dollars and have 3 layers of product to deal with.


I don't understand what you mean. For the Furuno/TZ/MapMedia NOAA charts we use, free is free, including annual updates. Unless something's changed?

On our previous Furuno system and our current (but old) TZ system, we had a choice of free US NOAA raster and vector charts, or paid C-Map charts for various places, or paid Navionics charts for various places.

I understand the Navionics option has gone south, but that still leaves C-Map options... and FWIW, they look OK on the apps we use, but I've not seen much in C-Map charts that improves on the free NOAA charts at least for the US.

At one point, circa 2001, C-Map charts had some added benefit with marina info, and they may still do that... but I think that's been OBE for several years now, given other available marina info sources.

-Chris
 
Last edited:
For those who are not aware, Furuno own 50% of MaxSea (TZ inventor). I used to run CMap, and have it on both a Furuno 12" MFD on the flybridge and on the PC running TZ. When updating, I was able to pay for one update and it would work on both systems, although I recall emailing them for an unlock code for the MFD at one point.

About a year ago I switched to Navionics which is probably a little better than Cmap for my cruising grounds in Australia, although there is not a lot in it. Likewise, just one map purchase for installing on both systems. The support folks at MaxSea (in France) have been great to deal with over the last 8 years.

Edit: I forgot to add that you can also buy satellite imagery from MaxSea, and it works with both CMap and Navionics. At times I display the sat image, in some places I prefer not to. Its just a couple of mouse clicks to change it up.
 
Last edited:
I don't understand what you mean. For the Furuno/TZ/MapMedia NOAA charts we use, free is free, including annual updates. Unless something's changed?

On our previous Furuno system and our current (but old) TZ system, we had a choice of free US NOAA raster and vector charts, or paid C-Map charts for various places, or paid Navionics charts for various places.

I understand the Navionics option has gone south, but that still leaves C-Map options... and FWIW, they look OK on the apps we use, but I've not seen much in C-Map charts that improves on the free NOAA charts at least for the US.

At one point, circa 2001, C-Map charts had some added benefit with marina info, and they may still do that... but I think that's been OBE for several years now, given other available marina info sources.

-Chris

Chris:

Since I'm not an owner of it, I am researching online and talking to dealers at shows. Set me straight if I don't have this right.

Furuno has 3 layers to the package. Hardware is Furuno. Then you have to buy / subscribe to TZ. Then you get charts. Any other option is 2 layers. I just don't get it on an expensive electronics package where you have to subscribe to 3rd party software to use the electronics.

Charts. Seems no one has ALL of the charts options. Part of what I'm trying to get a grip on is WHAT charts do I want. Yeah, all of them can deliver NOAA vector and rastor charts, so having that is no differentiator between MFD brands. But what do I want? You have pretty (which is in the eye of the beholder) but that's not my deal. This is an issue we have danced around earlier in this thread. Stuff can look pretty, stuff can look detailed, but is it ACCURATE? And it seems stuff can be great in one area and get you into trouble elsewhere. The perfect package seems not to exist, so options to bail out to something else seems important, if it seems right to do. Brands are backing into corners on that score.

NOAA charts are fine and in fact preferable in deeper open waters. Less clutter. But you are on the Chesapeake and you know a lot of anchorages have thin water and can be tricky. Open up a NOAA chart on some place like Fairlee Creek (Eastern Shore, Kent County, on the Bay north of the Chester River mouth). A NOAA chart won't get you in there safely. Now go online to the Navionics site and look at the detail, and that's much better. Now do the same thing with C-map. Both have more detail, but a bit different. Which is right? Cmor doesn't show its maps, so one can't judge it.

All the time I see people say they run something like NOAA charts on the MFD but have something like Aquamaps up on an iPad next to it. If you are running an older MFD and that's a solution to keep things working, that's great. If I am about to spend $35k on an electronics package and I have to have an iPad or laptop to make things work well on a brand new system, well that's pretty much a BS situation.

That's my quandary. Set me straight. Please. The dealers can't. They say that's pretty much true, and so just pick your poison.

We are talking Furuno at the moment. Simrad has its own issues. Garmin has its own issues. Rest assured I'm not picking on Furuno.
 
In US waters, the NOAA charts are the single-source-of-truth, even in the Chesapeake. The Navionics charts may appear more detailed, but that does not mean they are more accurate. Behind the soundings are a "Zone of Confidence" variable that underlines and undermines the actual validity of the sounding. Some of that is changing as bathymetric data is being crowd-sourced, but there is no reliable method to understand whether the crowd-sourced soundings are accurate.

Read more on Zone of Confidence at this Panbo article HERE.

Personally, I think many folks over-zoom their charting displays (PC, Tablet, or MFD). One thing I like about Coastal Explorer is they flash a bright orange banner when you over-zoom. In my mind, you still need to navigate via ATONs - charting products make it easier. That said, many people run an iPad too for a whole host of conveninece reasons but it really isn't necessary in US waters. What are some of those reasons? Read Active Captain reviews concurrent to approaching a marina or anchorage, etc.

In my opinion, in US waters, following ATONs on NOAA ENCs are the best way to minimize risk of getting into trouble. No gaurantees that you won't bump into something unexpected, but risk is minimized with NOAA ENCs. I can tell you that Coastal Explorer runs an update everytime I fire-up, and there are often several hundred updates per week.

Good luck

Peter
 
Peter: Find Fairlee Creek on a NOAA chart.

If you are fortunate to have local knowledge you will have heard: start in from well wide of the southern point, and basically centered in that bay. Keep the first marker tight to your port side but put your bow darn near on the beach and there is water close to the shoreline. Make the turn and you MUST put your bow right up to the beach ahead before making a 90 degree turn to starboard. If there is ANY current flowing out, gun it.

Now get that from a NOAA chart. You can't.
 
Peter: Find Fairlee Creek on a NOAA chart.


If you are fortunate to have local knowledge you will have heard: start in from well wide of the southern point, and basically centered in that bay. Keep the first marker tight to your port side but put your bow darn near on the beach and there is water close to the shoreline. Make the turn and you MUST put your bow right up to the beach ahead before making a 90 degree turn to starboard. If there is ANY current flowing out, gun it.


Now get that from a NOAA chart. You can't.
There are plenty of similarly sketchy places in Florida. If you have a commercial charting system that reliably captures local knowledge, I'm all ears. Until then, I'll stick with NOAA charts with ATONs for charting. Fine with local knowledge or braille method, but not via a charting system. Navionics or other may look accurate with all its contour lines, but there is no way to know. I've seen many instances where it is not. Not even close.

Peter
 
Last edited:
I spent a long time using a compass and chart books costing a couple of hundred.

I had hoped that a pair of $5k MFD's would beat a chart book that costs 5% of that.

Maybe not.
 
I personally like MFDs a lot. In a channel, placing a waypoint between channel markers and hitting NAV is pretty solid. Route planning, and of course all the other displays such as radar and depth.

But in the end, the underlying data has limits. In my opinion, those limits are often obscured by a lot of interpolated data that looks accurate but is best-guess unless in established channels. Old school skills of reading bottoms and following ATONs are still applicable.

Peter
 
I bought TZ Navigator last December. On Feb, 17th I added C-Map to it for $250. Now C-Map for your MFD is not the same format so its treated as two different products. A little disappointed but OK.

On May 3rd I receive an e-mail that C-Map for Navigator has been updated. Unlike Garmin and C-Map for your MFD, there is no free update within the first year or next update. They will only give you a free update within 30 days! But C-Map did send me a free update for my MFD! That was good and I bought that last year.

TZ did offer 50% off to update their map. If your thinking of updating ask when the next update will be released. In may case, I don't even have my boat in the water yet and if I want to update the maps I must pay for it and I already spent $1000 within the last 4 months on the software.

Just to add, I am not trying to put them down. Just buyer beware! Their tech support has been great. A big help for me in setting up the software for my boat.


Just for clarification garmin does not give a free update. I found this out last month.
 
Chris:

Since I'm not an owner of it, I am researching online and talking to dealers at shows. Set me straight if I don't have this right.

Furuno has 3 layers to the package. Hardware is Furuno. Then you have to buy / subscribe to TZ. Then you get charts. Any other option is 2 layers. I just don't get it on an expensive electronics package where you have to subscribe to 3rd party software to use the electronics.

Charts. Seems no one has ALL of the charts options. Part of what I'm trying to get a grip on is WHAT charts do I want. Yeah, all of them can deliver NOAA vector and rastor charts, so having that is no differentiator between MFD brands. But what do I want? You have pretty (which is in the eye of the beholder) but that's not my deal. This is an issue we have danced around earlier in this thread. Stuff can look pretty, stuff can look detailed, but is it ACCURATE? And it seems stuff can be great in one area and get you into trouble elsewhere. The perfect package seems not to exist, so options to bail out to something else seems important, if it seems right to do. Brands are backing into corners on that score.

NOAA charts are fine and in fact preferable in deeper open waters. Less clutter. But you are on the Chesapeake and you know a lot of anchorages have thin water and can be tricky. Open up a NOAA chart on some place like Fairlee Creek (Eastern Shore, Kent County, on the Bay north of the Chester River mouth). A NOAA chart won't get you in there safely. Now go online to the Navionics site and look at the detail, and that's much better. Now do the same thing with C-map. Both have more detail, but a bit different. Which is right? Cmor doesn't show its maps, so one can't judge it.

All the time I see people say they run something like NOAA charts on the MFD but have something like Aquamaps up on an iPad next to it. If you are running an older MFD and that's a solution to keep things working, that's great. If I am about to spend $35k on an electronics package and I have to have an iPad or laptop to make things work well on a brand new system, well that's pretty much a BS situation.

That's my quandary. Set me straight. Please. The dealers can't. They say that's pretty much true, and so just pick your poison.

We are talking Furuno at the moment. Simrad has its own issues. Garmin has its own issues. Rest assured I'm not picking on Furuno.


Well first, my previous Furuno equipment was NavNET 3D, installed in 2009... and my copy of TZ on the computers is v2.x from back then too... so things may have changed.

But I just go to this link and download charts, the free ones in our case (NOAA raster and vector, 3D, sat photos, bathymetric, fishing, etc.):

https://www.furunousa.com/en/products/gps_and_chart_plotters/browse?filter=Discontinued.eq.false&group={CFBDF652-0102-4A61-9835-CF99FD2D0A6F}&groupName=Charts%20for%20NavNet%203D,%20TZtouch,%20TZtouch2%20and%20TZtouch3

Or if that doesn't work for you, go here https://www.furunousa.com/en/products/gps_and_chart_plotters and then choose the Charts option.

Each download installs on both computers (TZ) and on the MFD (Furuno).

Yes, Fairlee Creek is tricky. The first local knowledge we had for entering was "drive the bow up on the beach, turn left 90°, drive the bow up on the beach, turn right 90°, power through the cut, E Voila!"

Yes, the NOAA raster and vector charts only show minimal detail. OTOH, I just checked not-up-to-date C-Map vector charts in their older Plan2Nav app, up-to-date vector charts in Wartsila's iSailor app, and up-to-date vector charts in Aqua Map... and all of those vector charts are all pretty much identical with the NOAA vector chart. I suspect if I checked the Garmin charts on the boat... same same (and if I remember, I'll do that next time on onboard and let you know if I'm wrong).

I think part of the point is that no chart will get you into Fairlee Creek safely without some luck; best to have some local knowledge to have a clue. For that particular place. And for others with similar issues (some inlets, for example).

We do use tablet apps, but that's about the charts only in one instance... otherwise, it's mostly for hot backup of the main MFD craps out*... but mostly for convenience... so crew can be wandering around the boat or sitting out of MFD view and still see/pay attention to where we are and where we're going.

(* PC with TZ, two laptops, two phones... lots of layers of back-up on board... never had an MFD failure yet...)

Aqua Map is indeed the slight exception to that; they also offer an inexpensive in-app purchase for "recent" (last 3 years) USACE survey data and that is specifically useful for traveling along some places in the AICW. That said, many just follow the ATONs with no problem... so it's not like this extra info is critical, especially for relatively shallow draft vessels and for navigators who can read the tide charts.

Garmin charges ($99, IIRC) for our vector chart update; I suspect that's an annual update, don't know yet. Haven't done this year yet. I don't notice their charts being any better, or even much different, than the NOAA vector charts.

We get our new Furuno TZT3 16" MFD installed next week. I've been assuming the newer MFDs use the same charts as the older units (that link above seems to confirm), but I''ll know more about that when the smoke clears.

-Chris

 
Last edited:
Chris:

What I have been using to compare things from a desktop investigation is this:

https://webapp.navionics.com/?lang=en#boating@14&key=%7BqtnFf%7BbpM


And this:

https://www.c-map.com/chartexplorer/

Look at Fairlee, which I am just using as a comparison example point for something I know to be tricky.

The NOAA charts tell you pretty much nothing. The Cmap really not much more, giving no indication of where the channel is. The Navionics shows you what you need to do, and where the advice to put your starboard side against the beach is premature.
 
FWT - where do you suppose Navionics or CMAP get their update data from?

Here is a brief description of NOAA source data for ENCs. How does Navionics reliably improve on this?

Frankly, I can think of a couple small inlets with privately maintained ATONs on the Florida Gulf Coast where eChart (MFD or tablet, NOAA ENC or Navionics) is incomplete, misleading, or simply wrong. There's only one thing worse than no data (ENC), and that's incorrect data (CMAP).

Honestly, I think this level of granularity is beyond the reasonable accuracy of a universal chart. Using a chartplotter to enter a small and tricky private channel means the chart is over-zoomed. Sometimes it will be correct. Sometimes it won't. It's not how charts are intended to be used.

Peter
 
Chris:

What I have been using to compare things from a desktop investigation is this:

https://webapp.navionics.com/?lang=en#boating@14&key=%7BqtnFf%7BbpM

And this:

https://www.c-map.com/chartexplorer/

Look at Fairlee, which I am just using as a comparison example point for something I know to be tricky.

The NOAA charts tell you pretty much nothing. The Cmap really not much more, giving no indication of where the channel is. The Navionics shows you what you need to do, and where the advice to put your starboard side against the beach is premature.


Not sure I understand your point about those links.

The Navionics chart I see at that link looks exactly like the NOAA vector, older C-Map, new iSailor, and new Aqua Map vector charts. I don't see any instructions?

The C-Map chart at that link adds contour lines, but otherwise looks the same as the others... and it looks like the contour lines are geometrically applied (versus soundings)... although that's just a guess.

-Chris
 
Not sure I understand your point about those links.


The Navionics chart I see at that link looks exactly like the NOAA vector, older C-Map, new iSailor, and new Aqua Map vector charts. I don't see any instructions?


The C-Map chart at that link adds contour lines, but otherwise looks the same as the others... and it looks like the contour lines are geometrically applied (versus soundings)... although that's just a guess.


-Chris

Pretty sure Navionics interpolates readily available soundings to create contour lines. There is an adjustment in the Navionics settings to define intervals. In my opinion, this is part of the reason I believe operators are given a false sense of data integrity. It looks much, much more accurate than it actually is.

Peter
 
Pretty sure Navionics interpolates readily available soundings to create contour lines. There is an adjustment in the Navionics settings to define intervals. In my opinion, this is part of the reason I believe operators are given a false sense of data integrity. It looks much, much more accurate than it actually is.


I didn't see contour lines at the Navionics link FWT posted. Saw contour lines at his C-Map link; they look interpolated.

-Chris
 
There are two Navionics offerings you can switch between: The default (which I presume uses the same data as everyone else) and their Sonar Chart (crowd sourced and unique to Navionics I believe).

I see no great value to their standard offering. I like the Sonar Chart data with the obvious caveats.

The now-removed Navionics option for some Furuno displays was the default, not Sonar Chart.
 
Navionics: bottom left corner click to select SonarChart
 
So for the sonar chart readings (which I believe requires an active subscription), how does Navionics adjust for transduce offset of the contributing vessels? You are talking about using this functions in skinny water. Difference of two feet is meaningful. And that assumes the data is otherwise accurate. And yet the graphic representation to the navigator is identical to a USCG maintained shipping channel - no adjustment for zone-of-confidence factors.

There's a difference between data and information.

Peter
 
Back
Top Bottom