Vector chart (ENC) soundings data

The friendliest place on the web for anyone who enjoys boating.
If you have answers, please help by responding to the unanswered posts.
Joined
Oct 19, 2015
Messages
2,457
Location
United States
Vessel Name
Pacific Myst
Vessel Make
West Bay 4500
In the thread Boat sunk in Glacier Bay marcs raises a good question in post #54
The latest NOAA ENC (vector) chart does, raster charts are no longer updated. The thing I haven't found and would love to know is how to figure out when/how the soundings were done for an ENC, with good old raster charts they are listed in the corner somewhere, like the attached example.
I've started this thread because the discussion deserves it's own thread.

That indeed is an interesting question. I don't have any answers, just starting to look into it. Input is very welcome from users more intimately familiar with the use of vector charts (ENC). I'll say up front I'm going to miss Raster and paper charts when they're gone. It's so easy to find nearly all the info and data a mariner of smaller and recreational vessels needs. I understand the benefits of ENC, especially to mariners of larger vessels. But they come at the risk of missing important info and data by mismanaging the settings on the plotter displaying the vector charts.

My initial thoughts are centered around NOAA's ENCs as displayed on OpenCPN because that's what I'm using at the moment.

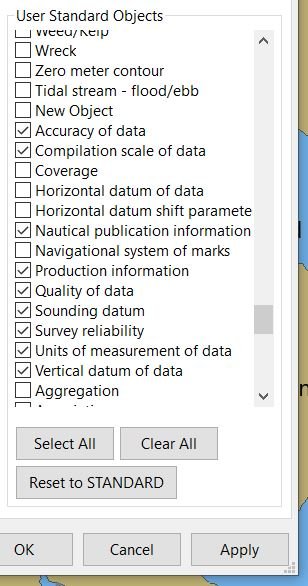
ENCs depending upon the plotter give the mariner the ability to turn off / on various settings. I've started to experiment with those shown in the attached image.

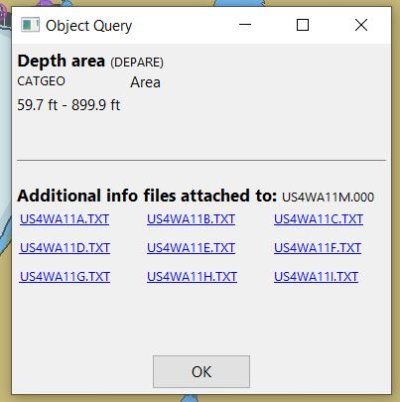
Also I can right click on an ENC select Object query and find a lot of info. Some about the soundings, some text that might be what's usually found on raster and paper charts. Lots to learn yet.

Yet another thing to consider is the Zone of Confidence. A good starting point to understand ZOC is here What is Zone of Confidence in Nautical Charts?

Lots to learn yet. As I said up top, raster and paper are so much easier. Right now it's a beautiful day and time to step away from the keyboard.
 

Attachments

  • OpenCPN ENC data.JPG
    OpenCPN ENC data.JPG
    50.4 KB · Views: 13
  • ENC text.JPG
    ENC text.JPG
    33.2 KB · Views: 12
In the thread Boat sunk in Glacier Bay marcs raises a good question in post #54 I've started this thread because the discussion deserves it's own thread.

Thanks for helping the original thread stay on topic.

I'll also miss raster charts (less so paper), they are an art form that gives a much clearer picture into the mind and works of the surveyors in places where coverage is imperfect and you need to make judgement calls. Thankfully with a system that lets me easily view both, raster charts will be useful for a long time even if not updated especially in areas that just don't change.

Yet another thing to consider is the Zone of Confidence. A good starting point to understand ZOC is here What is Zone of Confidence in Nautical Charts?
I also started looking into ZOC a bit last night after posting.

I ran across this 2016 post: https://panbo.com/noaa-introduces-zones-of-confidence-mind-your-zoc/

I do use Coastal Explorer, as Ben's example in the post does, however I have not found any ZOC data showing up in the Pacific Northwest. His post suggests NOAA is slowly updating charts starting on the east coast but that was quite a while ago. I haven't had a chance to try downloading the charts in his examples to examine them myself.

In the Glacier Bay chart referenced in the other thread (US4AK3DM) I do find this standard note:

CAUTION - QUALITY OF BATHYMETRIC DATA
The areas represented by the object M_QUAL (Quality of data) are approximate due to generalizing for clarity. Caution is advised, particularly for nearshore navigation or voyage planning. M_QUAL represents areas of uniform quality of bathymetric data. The CATZOC (Category of zone of confidence in data) attribute of M_QUAL provides an assessment of the overall zone of confidence.
...however I don't see any such data in Coastal Explorer. I do think there is a huge opportunity for improvement in how vector charts are displayed and what data they can contain and they have a lot of potential, but the current transitional stage is awkward to say the least. One of the biggest issues with electronic versions of raster charts is it can be very hard to find all the notes if you are using software that automatically tiles them and presents views of multiple charts at the same time and as you zoom in and out.
 
This is part of the reason I have a depth transducer in the bow of the boat where the draft is shallow. Much of the depth soundings on NOAA charts is quite old with a good portion predating the accuracy of GPS. In parts of my cruising in the Great Lakes and adjoining areas in Canada, soundings and contour lines can be significantly off. When the water gets skinny, I slow down (even more). Frankly, where the sounding information originates from isn’t all that important as I've found discrepancies on all the paper and electronic charting I've used.

Ted
 
Marc,

I've done some more digging into the issue. The short answer for NOAA ENCs is that we we don't have access to the info. If when it becomes available in NOAA's ENCs the display will be software dependent. For exampone at th is time CE takes a less is better approach to all the available data options on ENCs. OpenCPN takes the approach of giving the mariner as many options as possible and as much control as possible over the options. Neither is as easy to use as the old raster / paper source diagrams.

You also asked how to easly find source diagrams, notes etc on raster charts. The method I use is to turn off chart quilting then I'm viewing a single chart and all of it's notes etc visble by panning and zooming.

Sent from my SM-T500 using Trawler Forum mobile app
That's too bad. OpenCPN provides the ZoC information.

That said, this isn't rocket surgery. If you're in a commercial channel, ZoC will be relatively high and you can trust your chartplotter. If you're in an actively used recreational channel, ZoC will be less but still high. If you're going into an anchorage used by recreational boats, ZoC will be pretty low - chartplotter data is a best-guess.

I don't understand why this is so mysterious - why people are so accepting of the data from their chartplotter. There's a reason depth data are called "soundings." You have to actually sound the bottom to discern the depth. If it hasn't been done, it's an estimate based on interpolating contours. When exceptions are found, they are listed in Notice to Mariners prior to next update of soundings.

Much as I love chartplotters, they sure have taken a lot of the intelligence out of navigating. Created an entire class of zombie captains.

End Rant

Peter
 
Last edited:
That said, this isn't rocket surgery. If you're in a commercial channel, ZoC will be relatively high and you can trust your chartplotter. If you're in an actively used recreational channel, ZoC will be less but still high. If you're going into an anchorage used by recreational boats, ZoC will be pretty low - chartplotter data is a best-guess.

I don't understand why this is so mysterious - why people are so accepting of the data from their chartplotter. There's a reason depth data are called "soundings." You have to actually sound the bottom to discern the depth. If it hasn't been done, it's an estimate based on interpolating contours. When exceptions are found, they are listed in Notice to Mariners prior to next update of soundings.

This is very much a regional difference I think, I'm assuming the Saint Petersburg in your profile is the on in Florida. There is much more out there than channels and anchorages.

Up in the PNW/Alaska in most areas the rocks don't change much so the issue isn't charts being out of date as such, however some areas were last surveyed in the early 1900s using a lead line while others have better coverage via anything from a dragged net ensuring the area is clear to a certain depth to full coverage using modern multi-beam sonar. You can be a thousand feet from shore and in a thousand feet of water and then hit a rock.

The quality of soundings are often unrelated to the amount of current commercial or recreational use.

You can be darn sure I navigate differently in areas with many rock pinnacles and no modern soundings, and that is why I care about knowing that info and why it not being available on most NOAA ENCs isn't ideal. This is of concern in some parts of Glacier Bay, where this thread was forked off from, where folks do hit uncharted rocks on occasion. And then the rock becomes charted.

This is also why charts like Navionic's SonarCharts that just make up data between soundings/surveyed contours are dangerous when used inappropriately.
 
The Zone of Confidence is not the same information as shown in NOAA's raster/paper charts source diagram. Additionally the ZOC information is displayed differently dependent upon the plotter/software in use and the mariner's settings for ENC display whereas the source diagram is always there on raster/paper charts. In OpenCPN the mariner has to bring up the popup menu for “Object query” and look for “Quality of data, CATZOC” which is only an alpha numeric value. Valuable as long as the mariner is aware of the error assigned to each zone. But I'd like to know when a survey was made. Throw in that too many of NOAA's ENCs show CATZOC “U”which corresponds to Position accuracy “Not assessed” and Depth accuracy “Not assessed” making the ZOC on those charts nearly useless. That situation is getting better but still not fully resolved.

Yes reliable accuracy varies greatly with the use of the waterway. Vertical and horizontal accuracy. All mariners need be aware of that. For that reason I will still navigate by bearing and range when making my first transit of a remote lightly traveled area. When really pushing the limits I will do my own survey from the small boat. I have found both uncharted hazards and significant horizontal displacements this way. After I have safely made the transit I will use my proven track line in the future.

“Much as I love chartplotters, they sure have taken a lot of the intelligence out of navigating. Created an entire class of zombie captains.” I couldn't agree more. I've seen too many examples. Even so-called professionals.


Sent from my SM-T500 using Trawler Forum mobile app
 
Back
Top Bottom