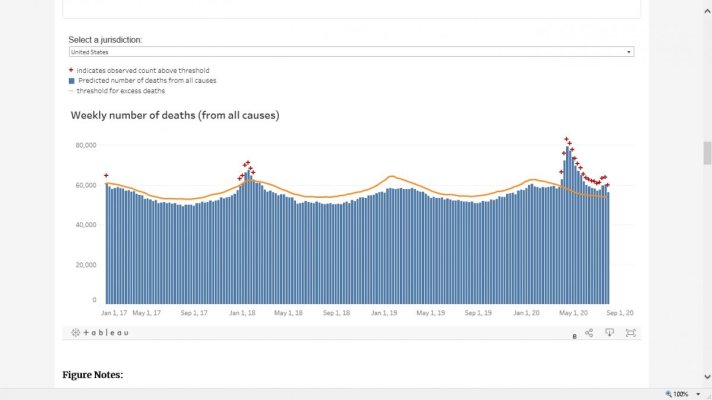
The Excess Deaths graph on this page is what was most interesting to me. The graph is about half way down the page. They didn't make it easy to link up so you might have to look around. Tableau was the data service, I guess.
Excess Deaths Associated with COVID-19
https://www.cdc.gov/nchs/nvss/vsrr/covid19/excess_deaths.htm
This is a link to the graph at Tableau:
https://public.tableau.com/profile/...s_mort_withcauses_08052020/WeeklyExcessDeaths
This is a more general link:
National Center for Health Statistics
Excess Deaths Associated with COVID-19
https://www.cdc.gov/nchs/nvss/vsrr/covid19/excess_deaths.htm
This is a link to the graph at Tableau:
https://public.tableau.com/profile/...s_mort_withcauses_08052020/WeeklyExcessDeaths
This is a more general link:
National Center for Health Statistics
Last edited: