Current Predictions

The friendliest place on the web for anyone who enjoys boating.
If you have answers, please help by responding to the unanswered posts.

jwag956

Veteran Member
Joined
Jan 15, 2020
Messages
58
Location
US
Vessel Name
Scrimshaw
Vessel Make
1990 GB 42 Classic
I am having a heck of a time getting various current prediction applications and sites to actually tell me the same thing! I have Windy, Aquamap, the NOAA site and a trusty 2022 Puget Sound & San Juan Islands Tides and Currents pocket guide.
Since we are headed up to the San Juans next week - I picked the West side of Lopez Island where there is a NOAA current monitor:
https://tidesandcurrents.noaa.gov/noaacurrents/Predictions?id=PUG1746_10

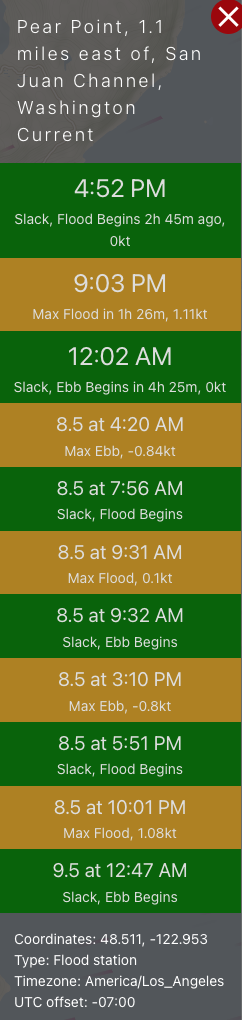
It was easy to find this on both the Windy and Aquamap apps as well. And it is listed in the pocket guide (as Pear Point, 1.1 miles east of, San Juan Channel)

First - Windy and Aquamap have identical data (whew!). However trying to correlate that with the NOAA site (which presumably is actually the source of data for all these apps) I am completely miffed.

I have attached screen shots from Windy and the NOAA web site for today (saturday). The times, speed etc. seem completely different.

For example - Windy shows Max Flood at 9:03PM at 1.11kt. The closest time on the NOAA site is 9:42PM at .56kt. Most of the other times/currents are even further off.

What am I missing? Who do I trust!

(Oh and I gave up trying to use the pocket guide - never came close to either of the others).
 

Attachments

  • PUG1746_10_Annual_2022.pdf
    69.1 KB · Views: 3
  • Screen Shot 2022-05-07 at 7.37.28 PM.png
    Screen Shot 2022-05-07 at 7.37.28 PM.png
    110.8 KB · Views: 32
For example - Windy shows Max Flood at 9:03PM at 1.11kt. The closest time on the NOAA site is 9:42PM at .56kt.
I see windy (with no date) 9:03PM but cannot find NOAA 9:42PM at .56kt on the current table. You said today as in May 7th.
7
Sa
12:12AM 04:54AM -0.9E
07:36AM -0.6E
12:48PM -1.3E
04:00PM 07:12PM 0.8F
10:24PM 0.6F
 
I was looking at the daily stats from the link I put in - you are looking at the 'year' table - but either way, they don't come close. The windy output of course is from May 7th evening through May 8th.

What do you use?
 
As a Predicted Log contestant for over thirty years, I can attest that current predictions are rarely correct. It is for that reason contestants run the measured mile before every contest.
 
I was looking at the daily stats from the link I put in - you are looking at the 'year' table - but either way, they don't come close. The windy output of course is from May 7th evening through May 8th.

What do you use?
so you are using May 7&8th from windy and the link is May 8 & 9th. But yes they are not the same on the 8th. Both are based on computer models designed separately and are a guide. Neither may be exactly correct.

I use a local based app "PNW current atlas" on smartphone for a picture view of the area which shows stronger and weaker current arrows.
I use windy for wind on phone and windy for wind, current, waves etc on laptop when planning.
They are tools.
 
I think at the low current levels you use as an example that accuracy is not likely to be accurate.

Personally I question the ability of sites like WIndy, Predict Wind, etc., to accurately predict hour by hour current rates. The gov't. site, at least the Can. Hydr., gives the maximum/minimum predicted rates and then using the tide tables YOU have to estimate the current strength between slack and max. based on the rise or fall difference.

Keep in mind also that current build and drop are NOT linear lines.

Atmospheric conditions such as a HIGH pressure or a LOW pressure weather system can alter the currents from the predictions. The weather is a totally independent force that cannot be included but can affect those predictions. A high wind , not forecast , can affect the currents.

Sorry but I think you are asking for to much accuracy. THese are PREDICTIONS. Or maybe better named, ESTIMATIONS.
 
Last edited:
First, confirm the time zone. Some take daylight time into account, and others don’t. And even worse would be if the report is based on UTC.

From there, current just has a lot of variability to it. Depending on the geography, wind will drive a tide pool up or down, resulting in higher or lower currents to fill/drain. Also, I regularly see significant variations in current over small distances in some areas. So the exact location matters if you are comparing sources. I think any predictions that are within 15 min should be considered the same.
 
We've found that for WA the tide tables are the best of a poor lot for current predictions. Then a big paper chart can be used to "help" assess flow patterns around the various islands and passes as tide levels vary.

BC has done a terrific job in providing date and time specific data for the areas between the US border and Cape Caution. For the Juan de Fuca to Gulf Islands to the Campbell River area we've found Murray Tables quite helpful.

Once into Central and Northern BC and on into AK charts and local tide tables seem the best way to assist current strategies. Plus listening to the locals who have decades of experience. Oh, then phases of the moon -----:confused:
 
Just remember wind predictions for most of out wind limits for cruising open water.....

https://www.google.com/url?sa=t&sou...QQFnoECAwQBg&usg=AOvVaw03GfSUDoEQPo21cfvPSoM-


Data from Macon, Georgia indicated that forecasts were accurate to within plus or minus 22.5 deg about 38% of the time. When a wider plus or minus 67.5 deg window was used, accuracy increased to about 79%. When forecast wind speeds were 15 mph or more, forecast wind direction improved in accuracy by about 15%.
 
We are currently in Deltaville finishing up outfitting and repairs. The weather here has been nasty the last few days. Being in a bay constant wind and it’s direction effects how high the bay fills and how fast. Same for the ebb. We’re on their work dock which is fixed. Given rain, rivers and run off at high tide the dock is nearly awash. Charted tide height estimate is at least a foot off.
As said above the numbers are estimates. Personally use NOAA. Don’t like windy for anything. But like weather tides/currents are hyper local. gribs and current grafts/charts are not infrequently a poor description of your reality. So don’t worry be happy. Any estimate is just that. A estimate. The generic estimate even if accurate is likely to be off where you are.
Many of my friends have stopped using speedos. Only use their gps for SOG . I like a speedo. Then with SOG I know the hyper local current.
The north east is weird. In several places two big bays are separated by a thin canal or narrow passage. Buzzards bay and Mass bay connected by CC canal, LI sound and east river/NY harbor connected by Hell Gate or LI sound to Harlem/Hudson.
Feel your pain and concern. That’s why in planning use some time in slack as the time to enter the narrow connection.
 
Last edited:
Back
Top Bottom