Problem in the Swinomish Channel

The friendliest place on the web for anyone who enjoys boating.
If you have answers, please help by responding to the unanswered posts.
In fairness to the skipper, there are a couple of things that could have contributed to his coming to grief.
My understanding is that it was nighttime when it occurred, and let’s assume there was he was not impaired. If he wasn’t paying absolute attention the lighted markers could have been lost due to the background lights. If a skipper isn’t familiar with the south entrance, identifying the markers can be a challenge even in the daylight. The gps signal could have been degraded causing him to be out of position. I’ve had some goofy readings in that area that I attribute to NAS Whidbey. They fly squadrons of jamming aircraft there and I don’t know anything more than they jam signals, I gotta believe that gps is one of them. If he was on Autopilot and not paying very close attention to his position, as happens all too much, and even if the gps is fine, a mistake in routing and the results can mean a collision with something.
Whatever the circumstances they are lucky to have survived without major injuries.
Re the Towboats appearing not to be doing anything, I’m guessing they are guarding the wreck both from less than honest people and the salvage claim.
Some years ago I was bringing a 47' Hylas (sail) from Deltaville VA to RI. This boat was new to the owner. We were taking it out with a local electronics tech to calibrate some new equipment. We were in the middle of the marked channel at 1000 on a bright sunny day,,,,,and ran aground. The owner is looking at me like he had second thoughts as to his choice of Capt. I looked to the local tech and said, rather defensively, "We're in the middle of the channel. His reply was, "That doesn't matter down here." The shoals shift almost daily. The markers are only an indication as to where the channel might be.
 
I was a QM on the boats, and if he was a skipper and didn't know which side, he should have been fired for incompetence. All of my skippers were extremely knowledgeable about the Rules of the Road, and rarely had to defer to me for any advice.
 
The boat has been removed and broken up. It was a 58’ Hatteras out of Tacoma, WA.
 
Today I met the folks who owned the boat. It happened after dark and the autopilot and a inaccurate GPS are to blame. He said he could not see the markers and by the time he did it was to late. I have also noticed lately that when I am abreast of the furthest marker out, my GPS does not show my boat right next to it. Also, the silt from the Skagit River has filled in a lot and it is much shallower than you are expecting. Don't cut any corners out there!

The boat was lifted out of the water with a large construction crane, taken ashore, and demolished. It no longer exists. It was a large Hatteras that they had owned for many many years.

They are not wasting any time. They were out boat shopping today and stopped in to look at my 49' Defever I have for sale.
 
Thanks for the update. I kind of figured that would be the cause. Glad everyone was okay. Good luck with your sale!
 
In support of Portage Bay;

Waggoner has a full page Swinomish writeup noting for the southern entrance "do not turn into the channel until the range markers in Dugualla Bay, to the west, are in line."

This is one of many places where AP and electronic charts should be treated as the secondary rather than primary navigation aids, fully utilizing fixed markers. I was reminded of this the other day when transiting past the infamous Oregon Rock in the Nanaimo channel.
 
Last edited:
Today I met the folks who owned the boat. It happened after dark and the autopilot and a inaccurate GPS are to blame. He said he could not see the markers and by the time he did it was to late. I have also noticed lately that when I am abreast of the furthest marker out, my GPS does not show my boat right next to it. Also, the silt from the Skagit River has filled in a lot and it is much shallower than you are expecting. Don't cut any corners out there!


The boat was lifted out of the water with a large construction crane, taken ashore, and demolished. It no longer exists. It was a large Hatteras that they had owned for many many years.


They are not wasting any time. They were out boat shopping today and stopped in to look at my 49' Defever I have for sale.
I'm curious. What GPS/Plotter/Charts are you using? Also do you know what system(s) the wrecked boat was using? If there are unrliable systems it would be helpful for all to know. I use both OpenCPN and Coastal Explorer. Both are loaded with NOAA RNC and ENC charts. When I went through the slough 2 days after the wreck then again 6 days after both systems showed everything is it should be. While I do favor the ranges and fixed markers over the electronic systems I still want to use all of the data I have at hand in place like that.

Also in Post #20 Bob Cofer notes that according to the LNM marker #13 was recently moved. This points to how important it is to keep charts up to date. And after Bob pointed that out I downloaed the relevant LNM and plotted the marker's new position. Even though I had updated the charts before our cruise they still showed the old position. Updated again while considering this situation and still the charts were wrong. This points to how important it is to use all available data especially in places where small errors can end in big problems. I'll admit in recent years I've gotten lazy about reading the LNM, putting too much trust in the electronic chart update process. In this case the descrepancy was very minor and would not likely lead to a navigation error significant enough to result in grounding. But that may not always be the case. I'm going to become a student of the LNMs again.

Sent from my SM-T500 using Trawler Forum mobile app
 
In my case I am using Nobeltec Time Zero using Cmap charts, downloaded March of this year. I believe he said they were also using Nobeltec. Also, the marker I am referring to is number 1, which is mounted on top of piling.
 
I'm curious. What GPS/Plotter/Charts are you using? Also do you know what system(s) the wrecked boat was using? If there are unrliable systems it would be helpful for all to know. I use both OpenCPN and Coastal Explorer. Both are loaded with NOAA RNC and ENC charts. When I went through the slough 2 days after the wreck then again 6 days after both systems showed everything is it should be. While I do favor the ranges and fixed markers over the electronic systems I still want to use all of the data I have at hand in place like that.

Also in Post #20 Bob Cofer notes that according to the LNM marker #13 was recently moved. This points to how important it is to keep charts up to date. [/URL]

In a different area, I was surprised during last month's very low tides, to find rocks actually showing where the chart said there were none within 6' of chart datum. These are rocks that have always been there, not shifting sand or moving marks. Local knowledge in many places is the only thing you have that can be truly accurate. I now have these rocks noted on my charts and can avoid issues in that area. Though not shown on my CHS charts, or on my C-Map plotter, and unknown to me at the time, Google Maps aerial map shows each of the three rocks I found exposed, near Hardy Island Provincial Marine Park.
 
I'm curious. What GPS/Plotter/Charts are you using? Also do you know what system(s) the wrecked boat was using? If there are unrliable systems it would be helpful for all to know. I use both OpenCPN and Coastal Explorer. Both are loaded with NOAA RNC and ENC charts. When I went through the slough 2 days after the wreck then again 6 days after both systems showed everything is it should be. While I do favor the ranges and fixed markers over the electronic systems I still want to use all of the data I have at hand in place like that.


The "autopilot and GPS made me do it" excuse sounds like just that - an excuse.
 
In my case I am using Nobeltec Time Zero using Cmap charts, downloaded March of this year. I believe he said they were also using Nobeltec. Also, the marker I am referring to is number 1, which is mounted on top of piling.

Cmap charts may be the answer to my question. I have no experience with them. Nobeltec in my experience has been trustworthy having used most of their products.


Sent from my SM-A125U using Trawler Forum mobile app
 
In a different area, I was surprised during last month's very low tides, to find rocks actually showing where the chart said there were none within 6' of chart datum. These are rocks that have always been there, not shifting sand or moving marks. Local knowledge in many places is the only thing you have that can be truly accurate. I now have these rocks noted on my charts and can avoid issues in that area. Though not shown on my CHS charts, or on my C-Map plotter, and unknown to me at the time, Google Maps aerial map shows each of the three rocks I found exposed, near Hardy Island Provincial Marine Park.
Agree with the accuracy of charts with respect to charts. I've found a few uncharted or poorly charted rocks especially in areas less traveled by commercial traffic and old surveys.

Sent from my SM-A125U using Trawler Forum mobile app
 
Relating to the Original Post on this topic, Google Maps shows the entry to Swinomish Channel on a low tide, all hazards visible.
 
I have the NOAA (raster and ENC), RayChart, Navionics, and CMap charts of that area. I quit using the CMap after a brief experience with them, tried to return them to CMap (they refused but sent the latest update for free which was just as bad). Then tried to sell the cartridge on EBay with no takers.

I would not use CMap in that area. That said, I agree with TT - should not have happened. "Never depend on a single source of navigational information." Futhermore, if uncertain, never enter an unfamiliar channel or anchorage in the dark.
Please share the reasons you no longer trust Cmap charts. If it is a problem with accuracy all here would be well served to know. As many have said don't put all your faith in GPS + electronic charts/plotters. I certainly am in that camp. Yet we all (or almost all) make use of GPS + electronic charts/plotters as our primary navigation tool.

Sent from my SM-T500 using Trawler Forum mobile app


I am increasingly disappointed in C-map charts, and have had mostly bad experience with them over the years.


Around 2012 I used them for a trip through the Canadian Maritimes. When I got to the Rideau, none of the detailed zoom levels worked, with the chart just going blank. These are the zoom levels you need to actually navigate, so they were useless. I had to buy Navionics to get through that section, so wasted $500 on c-map charts of the region.


Around the same time we went to the Bahamas. C-map was the only chart package at the time that included the Explorer charts which were by far the best charts for the Bahamas. This was a good experience with c-map.


In 2017 we spend a winter in Mexico. I would go so far as to say the c-map charts were a hazard to navigation, and certainly not an aid to navigation. On countless occasions following them would have ship wrecked the boat. They were another waste of $500.


I now have c-map charts on my tender chart plotter. They again are woefully incomplete and inaccurate compared to NOAA charts. I bought equivalent coverage in a Navionics chart card for about 1/3rd the price, and so far they seem much better. There's another $500 wasted on c-map charts.


I don't think I'll be buying any more.
Thank you for the review. I'll stay away from Cmap charts. I'll continue to use official NOAA for US waters and CHS for Canadian waters. Navionics are OK but I've seen a few errors with their charts.
 
Thank you for the review. I'll stay away from Cmap charts. I'll continue to use official NOAA for US waters and CHS for Canadian waters. Navionics are OK but I've seen a few errors with their charts.


Actual official charts are ALWAYS the first choice, e.g. NOAA for the US and CHS for Canada.
 
Please share the reasons you no longer trust Cmap charts. If it is a problem with accuracy all here would be well served to know. As many have said don't put all your faith in GPS + electronic charts/plotters. I certainly am in that camp. Yet we all (or almost all) make use of GPS + electronic charts/plotters as our primary navigation tool.

Sent from my SM-T500 using Trawler Forum mobile app
The only CMap charts I have tried were for the PNW, specifically around Puget Sound and the Salish Sea. Compared to Navionics and NOAA, very much detail was lacking, some features a decade or two out of date. This included things like rock breakwaters. Extensive communication with CMap about it, they seemed indifferent to even recording what I had found.

I understand from others that in some areas they are better than others. Like TT, I found the Explorer data much more accurate in the Bahamas than Navionics, but was able to get the Explorer data without CMap.

I keep a view of the NOAA (or CHS in Canada) raster charts up on one screen at all times as a check on the Navionics usually displayed on the primary plotter. I rarely see significant actual discrepancies between the two, however as has been true from the beginning, the raster charts - which are hand drawn by a human with the specific intent to draw your eye towards potential hazards - continue to do a better job of that than any vector offering.
 
Since the thread has drifted a bit i haven't heard garmin mentioned. heading from seattle to roche,nanaimo,pender harbour, squirrel cove,prideaux haven,okover inlet then working back to seattle.I have garmin with navionics on a ipad.Is garmin considered safe?
 
Since the thread has drifted a bit i haven't heard garmin mentioned. heading from seattle to roche,nanaimo,pender harbour, squirrel cove,prideaux haven,okover inlet then working back to seattle.I have garmin with navionics on a ipad.Is garmin considered safe?

I have two stand alone garmin plotters and keep my paper chart on the table any time I’m out of my slip. My experience has been very good with that setup. I don’t run it on an iPad or other device, just the plotters.
 
Since the thread has drifted a bit i haven't heard garmin mentioned. heading from seattle to roche,nanaimo,pender harbour, squirrel cove,prideaux haven,okover inlet then working back to seattle.I have garmin with navionics on a ipad.Is garmin considered safe?

Are your Garmin plotters running Navionics charts (whom they now own)? I've not seen any glaring problems in any of those areas with Navionics. A long time ago there were some issues with Garmin Blue charts in some other areas - don't know about those areas.

And to be clear, even with CMap and prudent navigation, you shouldn't get into trouble. Without prudent navigation, it probably doesn't matter what charts you are using. I know someone that knocked the vector drives off their high speed cruiser in that area, following Navionics on an iPad. Cut it a little close, weren't watching the tide, and bang, >$200K in damage.

Only the newer Garmin systems can run the latest Navionics charts. They have to have the higher resolution screens on them. That's why I run Navionics on a tablet.
 
I have three 8612s. I know garmin bough navionics. Do you guys know if the 8612s are using navionics?
 
........ however as has been true from the beginning, the raster charts - which are hand drawn by a human with the specific intent to draw your eye towards potential hazards - continue to do a better job of that than any vector offering.
Agree completely. Running around the San Juans this week ducking in and out of the shallows, dodging rocks and reefs to look for wildlife I had raster on one screen and vector on another for comparison. I could not have safely done what I was doing using vector charts. It will be a loss when NOAA drops raster chart production.
 
+1. True of CHS as well. The vector charts that replace them are soulless.


Agreed. At least as presented in OpenCPN, I find the NOAA ENCs to be rather ugly. Navionics vector charts are better in terms of readability, but I still prefer the look and feel of the NOAA RNCs and I hate that they're killing them off because they're "too much work to maintain".
 
+1. True of CHS as well. The vector charts that replace them are soulless.

Agreed. At least as presented in OpenCPN, I find the NOAA ENCs to be rather ugly. Navionics vector charts are better in terms of readability, but I still prefer the look and feel of the NOAA RNCs and I hate that they're killing them off because they're "too much work to maintain".
I agree with both of you, vector charts are just not "nice" to use. For me it's more than that. I can look at a raster chart get most of the info I need to do the kind of exploring I like to do. With vector not so much. Here are two examples from a recent fair weather cruise where in my opinion it's an acceptable risk to enter these areas looking for wildlife and the scenery up close. In both pairs of images comparing raster to vector you'll see my track in yellow. Then a more detailed comparison of raster vs vector of the entrance to a popular harbor on Lopez Island.

In the first pair using the vector chart the unwary might attempt to pass west of Nob Island then south of Cliff Island without knowledge of the rocks and kelp beds. Or between McConnell Island and Coon Island without knowing about the 0.3 fathom sounding on the NE corner of McConnell.

In the second pair you can see I safely pass between the north shore of Charles Island and the south shore of Lopez Island. Using the raster I have all the info I need. Using the Vector I might have gotten too close to Charles.

As I explore areas of BC and Ak that I have not visited before when raster charts are no longer available I will have to curtail my desire to travel the skinny waters.

Another issue with vector charts is the skill and attention to detail required by the user. With raster you get all you need by simply opening and viewing the chart. With vector depending upon the plotter used you either don't or can't get all the information by simply opening and viewing the chart.

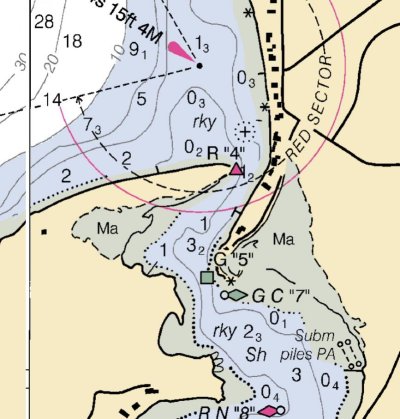
The last comparison is a set of 4 chart images of the entrance to Fisherman's Harbor on the west side of Lopez Island, a popular destination. These images are as displayed with OpenCPN which gives the user a deal of control over the vector chart display. Far too many to list here but the main ones are "All" which displays every possible bit of data in the chart, "Standard" which is considered to be what the user needs most of the time. "Basic" which is completely useless except for a gross overview. "User Standard" which is "Standard" edited by the user. With all of those the user can turn on or off text, depths, buoy/light labels, lights, light descriptions, anchoring info and show visible light sectors.

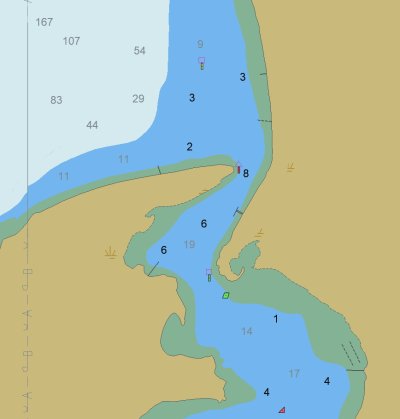
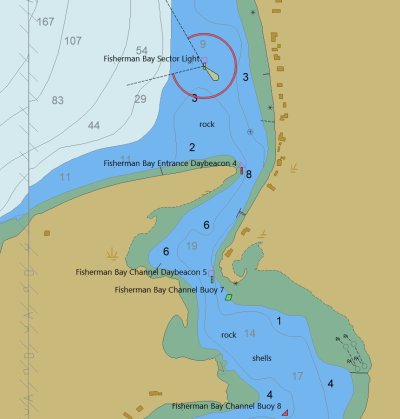
I'll confess that with my comparisons of raster and vector for Wasp Islands and Charles Island I used simply Standard to clearly make the point of what I see as the weakness of the vector display. In the images of Fisherman's Harbor entrance in addition to the raster chart I show vector standard, vector all and vector all with the options turned on.

In vector standard you see the level of detail that could get the mariner without local knowledge in trouble.

With vector all I can finally see the rock north of the entrance channel that is clearly shown on the raster display.

With vector all plus all options turned on I begin to get the level of detail I want but still not as good as raster. But there are still some problems. The wording "rock" is not warning the user of rocks. It is describing the bottom type just as the wording "shells" or "mud" will.

The most critical, in my opinion, data on a chart is the depths. Note that in the examples the raster and vector depths are different numeric values. Raster depths in the these examples are in fathoms, vector depths in feet. With OpenCPN this is set by the user. Also set by the user are shading for the depth contours.

This long winded post is meant to show that the mariner when using vector charts MUST be aware of how to correctly use them and how to correctly set up the plotter / app to display the needed data. This could well lead the uninformed or lazy into serious trouble.

I'm diving into such detail because I think there are many like me who for years moved easily from paper to raster which are really the same thing. And now with the pending demise of NOAA and CHS paper and raster we have to get comfortable and acquire the skills to safely use vector charts. If you're like me just beginning to dive seriously into vector there's a lot to learn. I hope you find this posting useful. If you are already a skilled user of vector charts please point out anything I've missed or gotten wrong. I trust you will, TFers are not known to be shy.

I am well aware of the technical advantages of vector over raster for the trained professional mariner and the hydrographic agencies. But I don't think small boat mariners especially recreational boaters are well served by the change from raster to vector.

There are options to the official charts. Navionics being the one I am familiar with and use at times. To the users of Navionics I caution you that I have looked at Navionics charts when in the lesser traveled areas of BC and Ak and that despite the apparent level of detail I have found their accuracy lacking. NOAA and CHS charts on the other hand are generally much more accurate though in areas not surveyed in recent decades may be horizontally displaced. That's another topic, this post is already too long. Any chart in the lesser traveled areas made from old surveys requires a great deal of caution in their use.
 

Attachments

  • Fisherman raster.jpg
    Fisherman raster.jpg
    98.5 KB · Views: 27
  • Fisherman vector standard.jpg
    Fisherman vector standard.jpg
    83 KB · Views: 23
  • Fisherman vector all.jpg
    Fisherman vector all.jpg
    132.3 KB · Views: 25
  • Fisherman vector all plus.jpg
    Fisherman vector all plus.jpg
    157.8 KB · Views: 28
Thank you, Portage Bay, for this write up. I’m new to the world of boating where you need charts, and while I have learned some navigation basics, it’s clear that there’s no simple or easy answer. What I conclude from your above, given that raster and paper charts are on the outs, learning vector charts in exhaustive depth is the best path for new mariners. But don’t rely too heavily on them.

We live in Dugualla Bay Heights, and from our house we can see the entrance to the Swinomish Channel. We’ve been having really low tides lately, and when the water is out at the most extreme, that channel appears to be little wider than your average country creek. The mud flats in this area are miles across, particularly in the area of the channel entrance. Navigating it doesn’t look fun to me at all. I can’t imagine doing it at night.
 

Latest posts

Back
Top Bottom