Delfin
Grand Vizier
- Joined
- Jan 20, 2010
- Messages
- 3,821
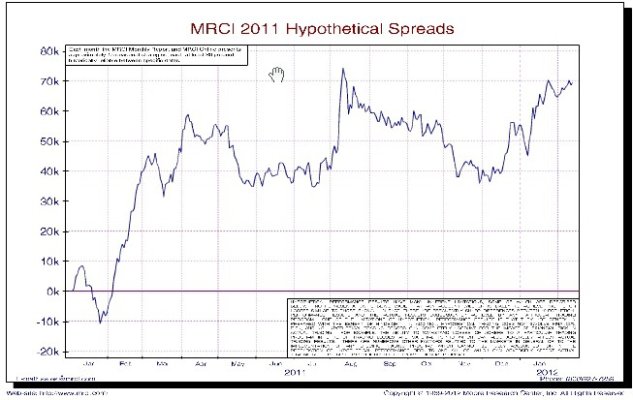
Occasionally in the past I have referenced commodity spread trading based on historical trends identified through Moore Research. *Without completely recovering old ground, spread trading is, in my opinion, a very low risk investment strategy because if done right, it covers multiple commodity categories, which results in a lower overall risk beta for the portfolio when compared to equities, bonds, or whatever. *Attached are the hypotehical 2011 results of following a single 1 x 1 spread for every suggested trade provided by Moore Research, which would require around $50,000 to handle maximum margin requirements. *MR provides an entry and exit date, a stop loss amount and of course, the long and short legs of the commodity. I can verify these results, and have found them consistently obtainable for many years, sometimes slightly better, sometimes slightly worse. *For 2011, the maximum draw down of equity was $10,000 and peak profit was $74,000 with an annual return for the 200 or so trades totaling $69,000. *This would be reduced by around $1,000 in commissions if an electronic trading platform like Interactive Brokers were used.
I don't have any interest in Moore, and only offer this to fellow retiring boaters who may still wish to generate investment income. *Buyer beware.
Images include:
1. The total returns by commodity category. *Within each category there would be multiple spreads involved, for example long April hogs while simulatenously short June live cattle.
2. The total returns for 2011 by month.
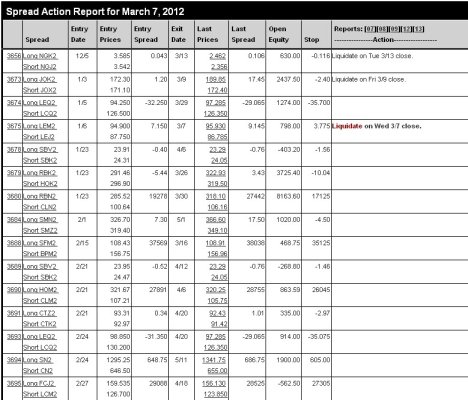
3. A snippet of the current spread trades currently active, showing the legs, the entry point, the exit point, and the current equity in the trade.
4. The hypothetical returns for the last 30 days, showing winning trades and the loss amount of these that reached the stop loss point.
I don't have any interest in Moore, and only offer this to fellow retiring boaters who may still wish to generate investment income. *Buyer beware.
Images include:
1. The total returns by commodity category. *Within each category there would be multiple spreads involved, for example long April hogs while simulatenously short June live cattle.
2. The total returns for 2011 by month.
3. A snippet of the current spread trades currently active, showing the legs, the entry point, the exit point, and the current equity in the trade.
4. The hypothetical returns for the last 30 days, showing winning trades and the loss amount of these that reached the stop loss point.