Actual vs. Calculated Power

The friendliest place on the web for anyone who enjoys boating.
If you have answers, please help by responding to the unanswered posts.

Mako

Guru
Joined
Jun 1, 2012
Messages
3,324
Location
USA
I would like to see how your actual powering over a long period of cruising compares to calculated values. Beebe's curves serve as very good baselines.

Personally I have found them to be relatively accurate, but perhaps that's because I hate pointing my bow into seas and wind except for short periods or when there is no choice otherwise.
 

Attachments

  • Powering Chart F1.jpg
    Powering Chart F1.jpg
    200.3 KB · Views: 227
  • Powering Chart F2.jpg
    Powering Chart F2.jpg
    197.1 KB · Views: 245
Here is the calculated power curve for my boat plotted on the power diagram for the Volvo-Penta D2-40 engine I installed. The rms error between prediction and reality was 0.3 knots over the entire range of engine rpms. Measurements were taken at 100 rpm increments. Displacement is 4.6 tons.

Volvo_d2-40_engine_diagram-1a.JPG
 
GI have an engine that develops about 40hp.
Three different marinizers advertise three different hp ratings. The three engines are rated as follows;

Westerbeke. ....... 44hp
Vetus. ....... 42hp
Klassen. ....... 37hp

I have been told that they all are based on the exact same engine ... the Mitsubishi S4L2. The only things different are exhaust manifolds, sea water pumps ect. But the power ratings are considerably different. The Klassen engine rating is taken directly from the specifications for industrial engines issued by Mitsubishi. The power ratings for the other two engines must be based on different standards.

This thread speaks of "actual" and "calculated" power. What elements does one use to "calculate" hp? ..... or actual power. What is the difference? And why is there a difference? It seems to me that if one is to calculate power and it turns out to be something other than actual power ... that method of calculation shoud be thrown out.


Oh I think I see what makobuilders is talking about. The actual power it takes to drive a boat at given speeds and the power indicated by various formulas to achieve those given speeds. Like my super simple "formula" of 4 to 5hp per ton of displacement for boats w FD hulls. It's not specific and for a reason. The variables are not specific. Some FD hulls take less power to drive than others. A Willard 36, a canoe, a tugboat and a sailboat all are FD boats but all are very different. And the hp per unit of weight required to go a certian speed will then be different.

So lack of specifics in the formula produces results that are not specifically correct. Calculations for power of a given vessel are from approximations, experience and other non-specific input. Basically a formula based on non-specific elements will produce non-specific results. But the non-specific results can with lots of experience become much closer to what one might call specific, real or correct. If one sees enought boats that are similar and one recognizes the similarities and differences then making projections based on all those observations becomes more and more accurate. But it's never perfect. And it gets better and better at a lower and lower rate. It's always some sort of a guess. Estimation may be a kinder word than guess .. I guess.

I left the first part of my response to this thread (see above) because some may have interesting comments that apply to engine ratings.
 
Last edited:
I've tried a number of times to plot out power/rpm/speed curves but I have trouble finding conditions without external effect from wind, current and waves. My data points never end up in a nice neat line. I guess I need more data to average out the graphs.


I have an engine that develops about 40hp.
Three different marinizers advertise three different hp ratings. The three engines are rated as follows;

Westerbeke. ....... 44hp
Vetus. ....... 42hp
Klassen. ....... 37hp

It's the paint, Eric. Buy yourself a can of yellow or red and you'll be planing.
 
The rms error between prediction and reality was 0.3 knots over the entire range of engine rpms.

TD- I don't quite understand the graph because there are no value for speed (your lines in red). So to clarify, what you're saying is that your actual speed is about 0.3 knots slower than what the graphs predict, and that you lose about 1.0 knot due to rough water versus smooth?
 
TD- I don't quite understand the graph because there are no value for speed (your lines in red). So to clarify, what you're saying is that your actual speed is about 0.3 knots slower than what the graphs predict, and that you lose about 1.0 knot due to rough water versus smooth?

My plot shows calculated horse power required to move the boat at different engine rpms. The 0.3 knot rms error means that the average error over the entire engine rpm range was 0.3 knots. To get speed from the horsepower data you need to know the specifics of the propeller (diameter, pitch, blade count, disk area ratio, blade style, etc.) as well as the propeller depth. The curves I plotted were expressed as horse power to move the vessel versus engine rpms in order to optimize the propeller settings for a specific engine.

The method I use to calculate horsepower uses hull parameters including, but not limited to: LWL, canoe body draft, wetted surface area, prismatic coefficient, waterline beam, displacement, longitudinal center of buoyancy and hull surface roughness. Those parameters are used to calculate the frictional/viscous resistance as a function of vessel speed. After that the wave making resistance is calculated from the same parameters and the vessel's Froude number. I also calculated the wind resistance of the vessel for both moving through still air and into head winds. Finally, I calculated the additional resistance for running into head seas.

As far as engine power ratings are concerned, the Mitsubishi engine used by the engine marinizers you listed can have a variety of horsepower outputs based on injection pump governor settings and choice of injectors. Also there are different ratings for different applications. In marine ratings there are pleasure, intermittent and continuous duty ratings that decrease in rated horsepower in the order shown. These different ratings are also at different full throttle rpms for the same engine. Westerbeke, for example has derated the nominal Westerbeke 44 to meet new emissions standards. That derating is done by changing governor settings to limit top rpms. A few years ago it was rated at 48 hp for pleasure use. As I recall, they changed maximum rpms from 3,000 to 2,800 when they derated the engine. The Vetus version went through a similar process. That same engine will have a different pleasure rating in Europe than it does in the US because of different emissions standards for small diesel engines.
 
AusCan,
Oh I really wanted that yellow paint on the Vetus. The Westerbeke Red not so much. I got the Mitsubishi flat black. Same black paint as you'd see on a Mitsu tractor engine. And I think that's where most S4L2s go. Klassen sells almost exclusively to the fishing fleet in BC Canda and Alaska USA and they just don't even give a rats ass about pretty paint. So I got Mitsu flat black. But I got all the other stuff that was much more important to me than the pretty color. But that yellow almost got me. When I had my BW trans rebuilt I had them paint it w Por-15. It's glossy black but after it's been in the bilge for 10 years it's all just black. I don't like black .. not even on cars.

TDunn,
Looks like you're working w a graph that's approximating the power required to drive a hypothetical boat. Such a load graph was presented in my Sabre 120 engine manual. How can you know how much power an engine is producing at partial throttle? Are you assuming it develops "x" amount of power because the hypothetical boat is going "x" fast? Yes .... the propeller specifics. But what is Propeller "depth"? Another word for "rake"?
In your "hull parameters" you make no mention of AusCan's yellow engine color. That's going to slow him down a bit. My cruising speed is limited to 6.15 knots w flat black. HAHA.

Yes I assume Westerbeke may have been using SAE formulas to calculate hp and Vetus uses a European calculator or something similar .. but different. I'm fairly positive that's the case.
But why would Vetus and Westerbeke go to the trouble of buying different injectors and buck'in up for the labor to install them when they are building an engine to a price and the engine market is quite competitive. I paid much less for my Klassen than one would pay for a typical marine conversion but I'm sure it was related to marketing and not different injectors ect. And the engines are all rated at 3000rpm. The Perkins engine was rated at wildly different rpms. 3000 = 36hp, 3600 = 40hp and 4000 = 50hp. When you see boats w this engine (4-107/8) they usually say it's 50hp. In the case of Willard it was about 33hp as they overpropped the boat. Same w GB.
But you may be right. Different injectors, timing, throttle limiters ect. I'm not sure. But one thing I am sure of is that my Willard 30 has more power than it needs. That's 5 hp per ton.

makobuilders,
One can clearly see that a SLR of .8 to 1.0 is the place to be. The 2nd graph shows about 14hp needed for the Willard 30 and I think I'm applying about 18. But it's all about approximations. I know though that I could have done everything I did do w Willy had I bought the 33hp destroked version of my 37hp S4L2 Mitsu. I think that's closer to 4hp per ton.
 
Last edited:
Manyboats, my graph was calculated from specific hull parameters for my boat. The curves would be different for your boat. In order to generate the curves in my drawing I took the lines for my hull and did the weight calculations. My calculation is not at all generic. I could just as easily have plotted boat speed versus engine rpms for my boat using the specifics of my prop and transmission gear ratio.


The diagram I posted was created for the purpose of determining the prop pitch required for the engine to achieve rated rpms at wide open throttle under flat water conditions and also closely approach rated rpms in rough conditions. The ideal is to be slightly under propped for flat water and slightly over propped for rough water. Prop pitch is a parameter that can be either input or optimized in the program I wrote to do the calculations.

My 39.6 hp rated Volvo-Penta D2-40 pushes my boat to just over 9 knots on flat water with no current at wide open throttle. Boat speed is about 7 knots at 2,000 rpms. I normally cruise at either 1,700 rpms (6 knots) or 1,900-2,000 because my shaft has a resonant vibration around 1,800 rpms. The power calculations are confirmed by fuel consumption data.
 
OK good.

My boat is slower yes at 6.15 knots w 2300rpm. Don't know exactly what my top speed is and have no need to know. Can't find any water w/o current any way. I'd like to generate a graph showing speed at 1400rpm to 2500 rpm and at 100rpm increments. I'll probably need to go through the locks into Lake Washington (behind Seattle) and do this. That may be fun anyway.
 
What is missing from this discussion is how to use Beebe F1 and F2 graphs.

Simply put, you find a number on the F1 graph and multiply it by another number from the F2 graph. F is for Factor best I can tell.

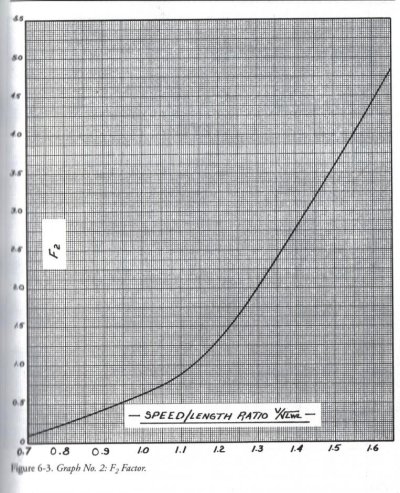
The F2 graph is the same irregardless of the boat since the graph is all about the F2 factor for a given Speed Length Ratio(SLR). I think the graph is based on Froude's numbers.

The speed of a boat is the SLR times the square root of the water line length of the boat.

At the bottom of the F2 graph, find the given SLR, go up to the dark line and then go back to the left to find the F2 factor. I wish Beebe had just given us the F2 factor for SLR 1.0, 1.1, 1.2, 1.3 and 1.34 and 1.4 and been done with it. Sure would save my eyes from looking at those little lines..... :rofl:

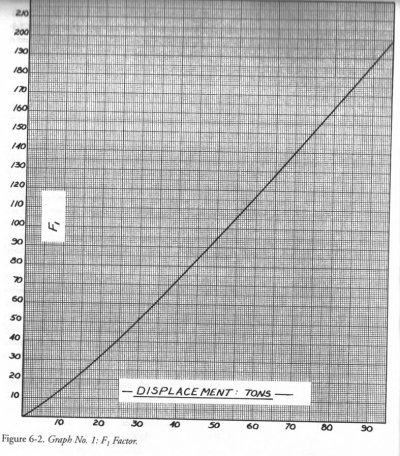
The F1 factor is based on the displacement of the boat in LONG tons, ie, 2,240 pounds, not 2,000. From the number of long tons on the bottom of the graph go up to the line drawn across the page and then follow the horizontal line to the left side to find the F1 factor.

F1 x F2 gives you the HP required to go at a given SLR.

Skene and Geer also have equations to calculate the required HP for a given boat.

Skene's equation generates a lower HP than Beebe with Geer's equations, he has three of them that I know of, that are higher than Skene's or Beebe's.

Later,
Dan
 
OK good.

My boat is slower yes at 6.15 knots w 2300rpm. Don't know exactly what my top speed is and have no need to know. Can't find any water w/o current any way. I'd like to generate a graph showing speed at 1400rpm to 2500 rpm and at 100rpm increments. I'll probably need to go through the locks into Lake Washington (behind Seattle) and do this. That may be fun anyway.

You could use BeeBe's graphs to calculate the HP required to move your boat at a given Speed Length Ratio(SLR), and then if you engine has published a prop curve, figure out which RPM is required to generate that needed HP.

Then you could see if BeeBe's equation is right, wrong or in the ball park. :lol:

The big variable will be the published prop curve. If it has been published. :)

Later,
Dan
 
Skene and Geer also have equations to calculate the required HP for a given boat.

Skene's equation generates a lower HP than Beebe with Geer's equations, he has three of them that I know of, that are higher than Skene's or Beebe's.

Personally I have found Beebe's approximations to be relatively accurate, not only in "completely smooth" water, nor of course bucking into head seas, but in average conditions, after burning about 1,000 gallon of diesel (1250 nm).

So I was curious if others have found this to be similar to their own experiences in cruising.
 
dannc,
My engine was destined for tractors and generators. So there's no "prop curve". However if TDunn is incorrect about fuel injectors ect I could use the curve for the Vetus 42hp or the Westerbeke 44. But my engine is installed in my boat so I have no need to know now. It would be nice to know what speed we're going at a given rpm. Estimating arrival times would be more accurate but I'm probably accurate enough as it is. But when I was shopping for an engine for my boat I was overlooking nothing that could bring me closer to the exact required power. I'm not at all displeased w the route I took or the results as I feel the boat is almost perfectly powered and if I was to do it all over I'd probably have the same engine. And I agree w whomever said it that being a little underpropped is good. I shoot for about 50 to 75rpm underpropped.
 
The Bebe tables are to help design a boat or asses a boat , for suitability for your purposes.

The variables are far to great to expect better than 80-90% accuracy.

That is good enough for planning , a sea trial would be required to create the as built boats performance.
 
You could use BeeBe's graphs to calculate the HP required to move your boat at a given Speed Length Ratio(SLR), and then if you engine has published a prop curve, figure out which RPM is required to generate that needed HP.

Then you could see if BeeBe's equation is right, wrong or in the ball park. :lol:

The big variable will be the published prop curve. If it has been published. :)

Later,
Dan

The propeller curves published with engine power curves are totally generic and meant only as examples. They take the general form:

php = a x rpm^2.7

where "php" is horsepower at the propeller, "a" is a matching constant, "rpm" is engine rpms and "2.7" is an exponent for average boats. "a" is calculated from the engine power output at maximum rpms and maximum engine rpms. The idea is to have the model propeller curve intersect the engine power curve at maximum engine rpms.

Because those curves are model curves, they are not usefull for a specific boat. For a specific boat you have to calculate the propeller power curve as I described above. To calculate a propeller power curve you need the propeller parameters (diameter, pitch, number of blade, disk area ratio and propeller style), the transmission gear ratio and the hull parameters.

An easier, but more time consuming, way to get an approximate propeller power curve is to monitor fuel consumption at given engine rpms. Modern diesels generate approximately 19-20 hp per gallon per hour of fuel consumption.
 
With total of 510 hp twins in our 34' 22K lb loaded-weight planing hull Tollycraft I work on time vs cost parameters, more than curved graphs. Faster we go more time is saved in transit. Slower we go more cost savings is realized. Can get: near 3 nmpg at 5 knots on one engine / 2 nmpg at 7 knots with both engines / 1 nmpg at 16 to 17 knots with twins just a humming / OMG nmpg at 22 knots WOT!

I know this I say has little to do with the very well presented facts and conjectures being posted in this thread - but - I simply wanted to post so that my email is notified when you guys post so I can keep track of your inputs.

Thanks, Art
 
Being retired I have time in abundance. Money, on the other hand, is less abundant so I prefer to go a bit slower. My cruiser gets 22 nmpg at 5.5 knots and 15.5 nmpg at 7 knots. At wide open throttle I get 4.5 nmpg at a blazing fast 9 knots. I buy my fuel in 5 gallon increments :).
 
To add to this I file away in my head as many known examples as I can. I even got numbers on, made hull observations when in drydock and observed the wake of Alaska state ferries. Re FD hulls the ones to observe were the ones w the greatest displacement and the smallest amount of power. One can learn from such boats. Power can mask many variables. As an example there was one old wood boat (about 65') featured in PMM that had only 2hp per ton. When this was real important to me I should have payed more attention to sailboats as they are minimally powered. Displacement boats are very simple in this regard compared to SD types. For them about all one can do short of going to Westlawn is compare many boats w known power, speeds and displacement. The displacement is more important as a powering variable than on FD types. I think length to beam ratios are also more important on SD hulls. Stern shape is far more important than bow shape on both. Rocker on a SD can make it much more easily driven but also much more speed limiting. Low displacement, a relatively low beam and rocker all combined can make a SD hull almost as easily driven as a FD boat at lower speeds. Comparing as many boats as possible works for me.
 
Last edited:
Back
Top Bottom