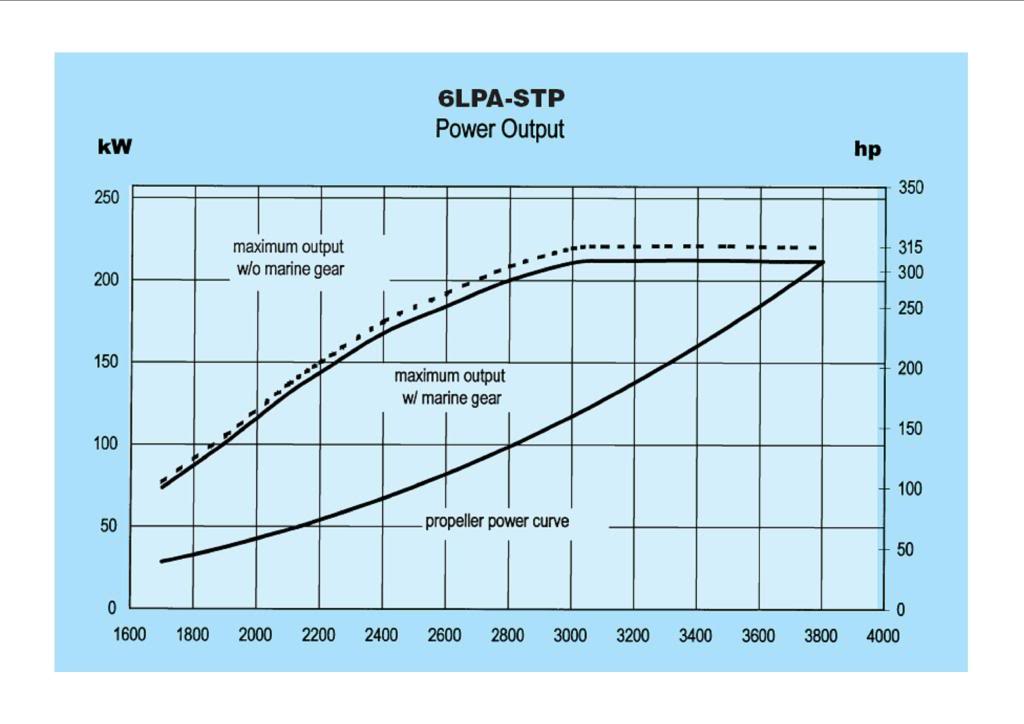
belowi is an example of a typical diesel engine fuel use vs RPM chart. Often people use the more frequently available top curve to estimate fuel use.
That is incorrect and over estimates fuel use because that curve shows the maximum power the engine is capable of producing at any speed and the fuel required to do so. The lower curve, the prop demand curve, shows the fuel used by a typical propeller loaded to achieve the rated MAX RPMs
Prop demand curve is what owners will see in their boats if propped properly.
Last edited: