MaxSea Navigation Software

The friendliest place on the web for anyone who enjoys boating.
If you have answers, please help by responding to the unanswered posts.

Jknox0601

Veteran Member
Joined
Jul 1, 2019
Messages
48
Location
USA
The boat I am in the process of purchasing has this software loaded on a dedicated computer which is hard wired to the boat’s electronics. I don’t yet know all of the details about which systems are integrated, but I was wondering what folks’ general impressions are of this system, especially for cruising the PNW up as far as AK. Anyone out there using this? Is there a module for it that covers tides and currents in sufficient detail to be reliable in the various tidal narrows along the inside passage? Which charts — raster or vector — do folks find the most useful? (I will of course have a set of paper charts and tide tables aboard as well).
 
We use MaxSea TimeZero on a laptop, but it's a back-up for us, not primary. OTOH, the biggest reason we use that is because it mirrors the charts and functions of our main fixed Furuno NavNET 3D plotter... so we didn't have much of a learning curve for TimeZero.

Ours is V2.xxx so very old by now... but it's a very capable nav application... OTOH, ours isn't networked, so I don't have experience with sensor inputs other than a simple GPS. OTOOH, their manual is extensive, covers topics like other sensors, so I'd expect it to be about as good as most other options that were available at time of installation... assuming inside installation, no particular issues with waterproofing and daylight readability (which would be computer -- not TimeZero -- issues).

Can't speak to PNW/AK, but the NOAA charts we use seem to be pretty good, and I haven't seen a need to try $$$ C-Map or Navionics charts for that... especially since it's cheap to get C-Map (for example) charts on a tablet nav app as yet another backup in our case.

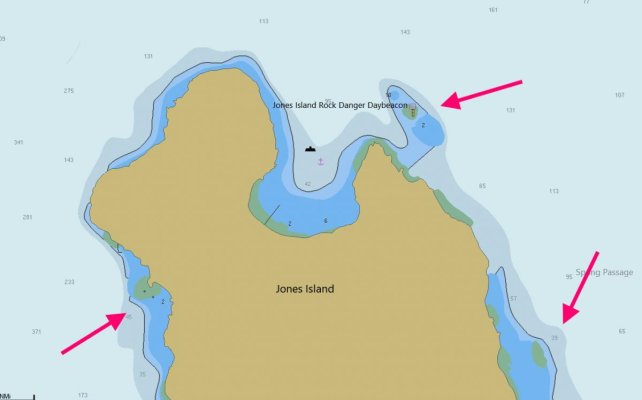
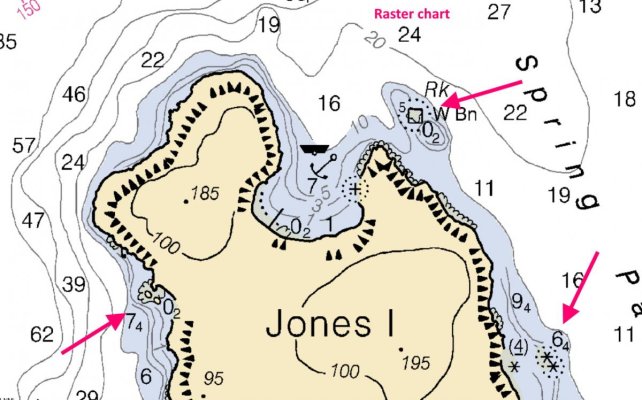
I tend to use raster charts on the plotter (or laptop) while wifye uses vector on a tablet backup app. OTOH, sometimes I switch, and sometimes I split the plotter screen into a 2-part display, one raster, one vector. Can't remember if I've tried split screen on the laptop...

Yes, there's a toggle to switch current markers on and off, and tide station markers are available. These are all from predicted data though, so we tend to double- and triple-check with other apps to look for more current :) supporting/confirming info.

FWIW, we do not keep paper charts aboard, other than what's available in a few simple area chart books or cruising guides. Thta's mostly because we have the plotter and the laptop with NN3D/TZ plus three tablets and three different nav apps (2 moore brands of vector charts)... plus two smartphones with those same apps should it become really necessary. The original reason is because we don't have an easy place near the helm on our flying bridge to lay out big charts and use typical tools (parallel rule, etc.) with them.

-Chris
 
When I originally commissioned my boat, about 10 years ago, we installed a Furuno NavNet3D black box network that included three black boxes. The video cards in those black boxes failed and replacements were not available. In researching alternatives, I learned that the MaxSea Pro software is essentially what is run on the black boxes (and the black boxes are just PCs running MaxSea software under a Windows shell). So, I built a new 3-PC network (because of all the locations at which I need to display and control the navigational and related software) running MaxSea Professional. I have no regrets, although there are some downsides: 1. The MaxSea software includes "features" not included on the version running on the Furuno black boxes, so it is a little more complicated to use, 2. Rather than using a control panel with dedicated buttons, I now use a combination of touchscreen (which works for most stuff), mouse, and wireless keyboard (which is useful for entering text, and which was a PIA with the blackbox control board, since it lacked letter keys), and 3. Probably hurts resale value.
 
Wifey B: Love MaxSea. I'm a Furuno fan but we have MaxSea as backup to both Transas and Furuno and sometimes use it as much as them. :)
 
Another MaxSea fan here. Use it in the pilothouse, and also have a second copy on a laptop there as well. On the flybridge I have Furuno NN3D, but much prefer the MaxSea, and use a mouse. Keyboard is there as well, but seldom needed once you have the system configured.
 
.....
Which charts — raster or vector — do folks find the most useful? (I will of course have a set of paper charts and tide tables aboard as well).

The choice between raster and vector charts is both a personal preference and an understanding of the value and usefulness of both. You’re on Greenbank on Whidbey Island? I’ll use a somewhat local example to make my points. Jones Island State Park. I know of a boat that got tripped up approaching Jones and ran aground on the rocks on the N.E. corner of the island.

Have a look at the two charts, raster and vector. The magenta arrows are mine. The day beacon is white, non-directional. The shoal more clearly shows on the raster chart, in my opinion. Look at the rock piles on the eastern and western shores of the island. Think about which you’d like to use approaching an unfamiliar area?

A few other things to consider when using Vector charts.
- You can turn off or on many features. Make the wrong choice and things like the day beacon or the soundings disappear.
- Many plotter displays when used in heads up or course up will keep the text “right side up” on a vector chart.
- Many plotter displays can show the arc of visibility of lights on vector charts.
- Vector charts in the U.S. are more frequently updated than raster. But for Wa, BC and Ak that isn’t in my opinion a huge advantage. Yes buoys and lights may change but the rocks don’t move much.
- On some plotter displays raster or vector may be easier to see.

There are many other differences, you’ll just have to mess around with both and make your decision.

I like having both loaded. But in my opinion if I had to chose just one format for Wa to Ak it would be raster hands down. Maybe it’s because raster is an exact copy of paper charts and I’m old skool.

A bit more to think about. I know of a few instances of missing data on vector charts. Though it has been with proprietary charts not NOAA or CHS products.

Regarding MaxSea. It’s an incredibly powerful program, maybe too powerful or at least too complex. I much prefer something simpler to use like Rose Point’s Coastal Explorer.
 

Attachments

  • Jones vector.jpg
    Jones vector.jpg
    42 KB · Views: 35
  • Jones raster.jpg
    Jones raster.jpg
    114.8 KB · Views: 36

Latest posts

Back
Top Bottom